Adding Metrics to Java Play on Heroku
Recently I've been working on adding metric reporting into an existing application using the great Metrics library from Coda Hale. Adding it to Dropwizard applications is extremely easy but adding to Play is more tricky, so I've created a sample project to record how to do this.
Metrics are a vital tool in monitoring the health of your application but are often overlooked early in development. Without some way of seeing how your application is behaving under use you can end up relying on your users to tell you what's going on, being reactive to problems instead of proactively monitoring and taking steps to prevent them. Metrics can be simple as number of active operations, or as complex as JVM usage and detailed request result breakdown, any thing you think will help monitor the health of your application.
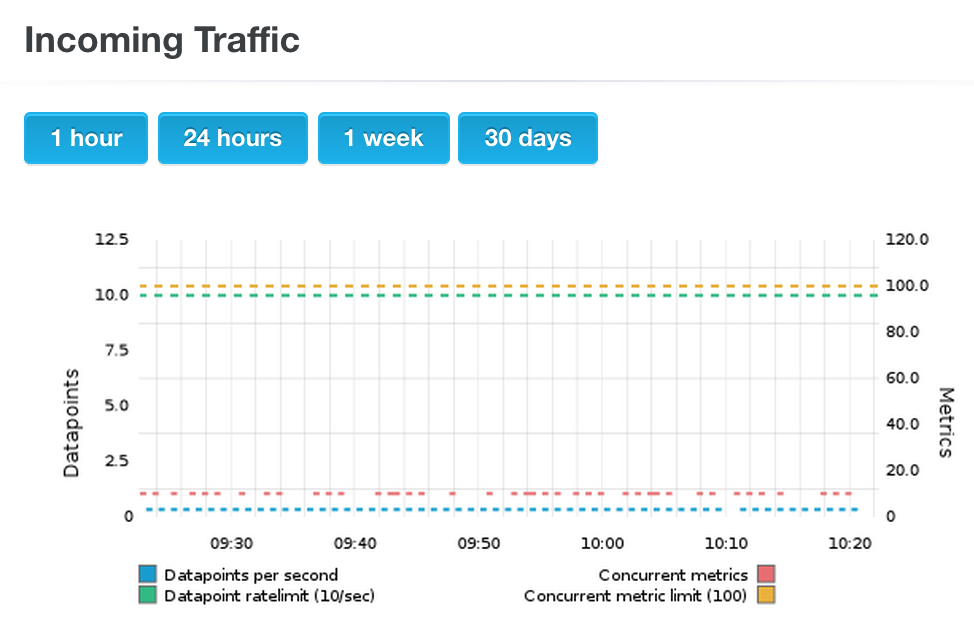
Once you have some metrics being produced you need a way to see them, in this example I'm using open source Graphite for storing and graphing the metrics data. Metrics has a reporter library which periodically sends the metric data to Graphite. Once your data is in you can create custom graphs that suit your monitoring needs. Heroku offers a free hosted Graphite instance (with usage limitations) so I'm using it in this application as an easy way to setup and try Graphite.
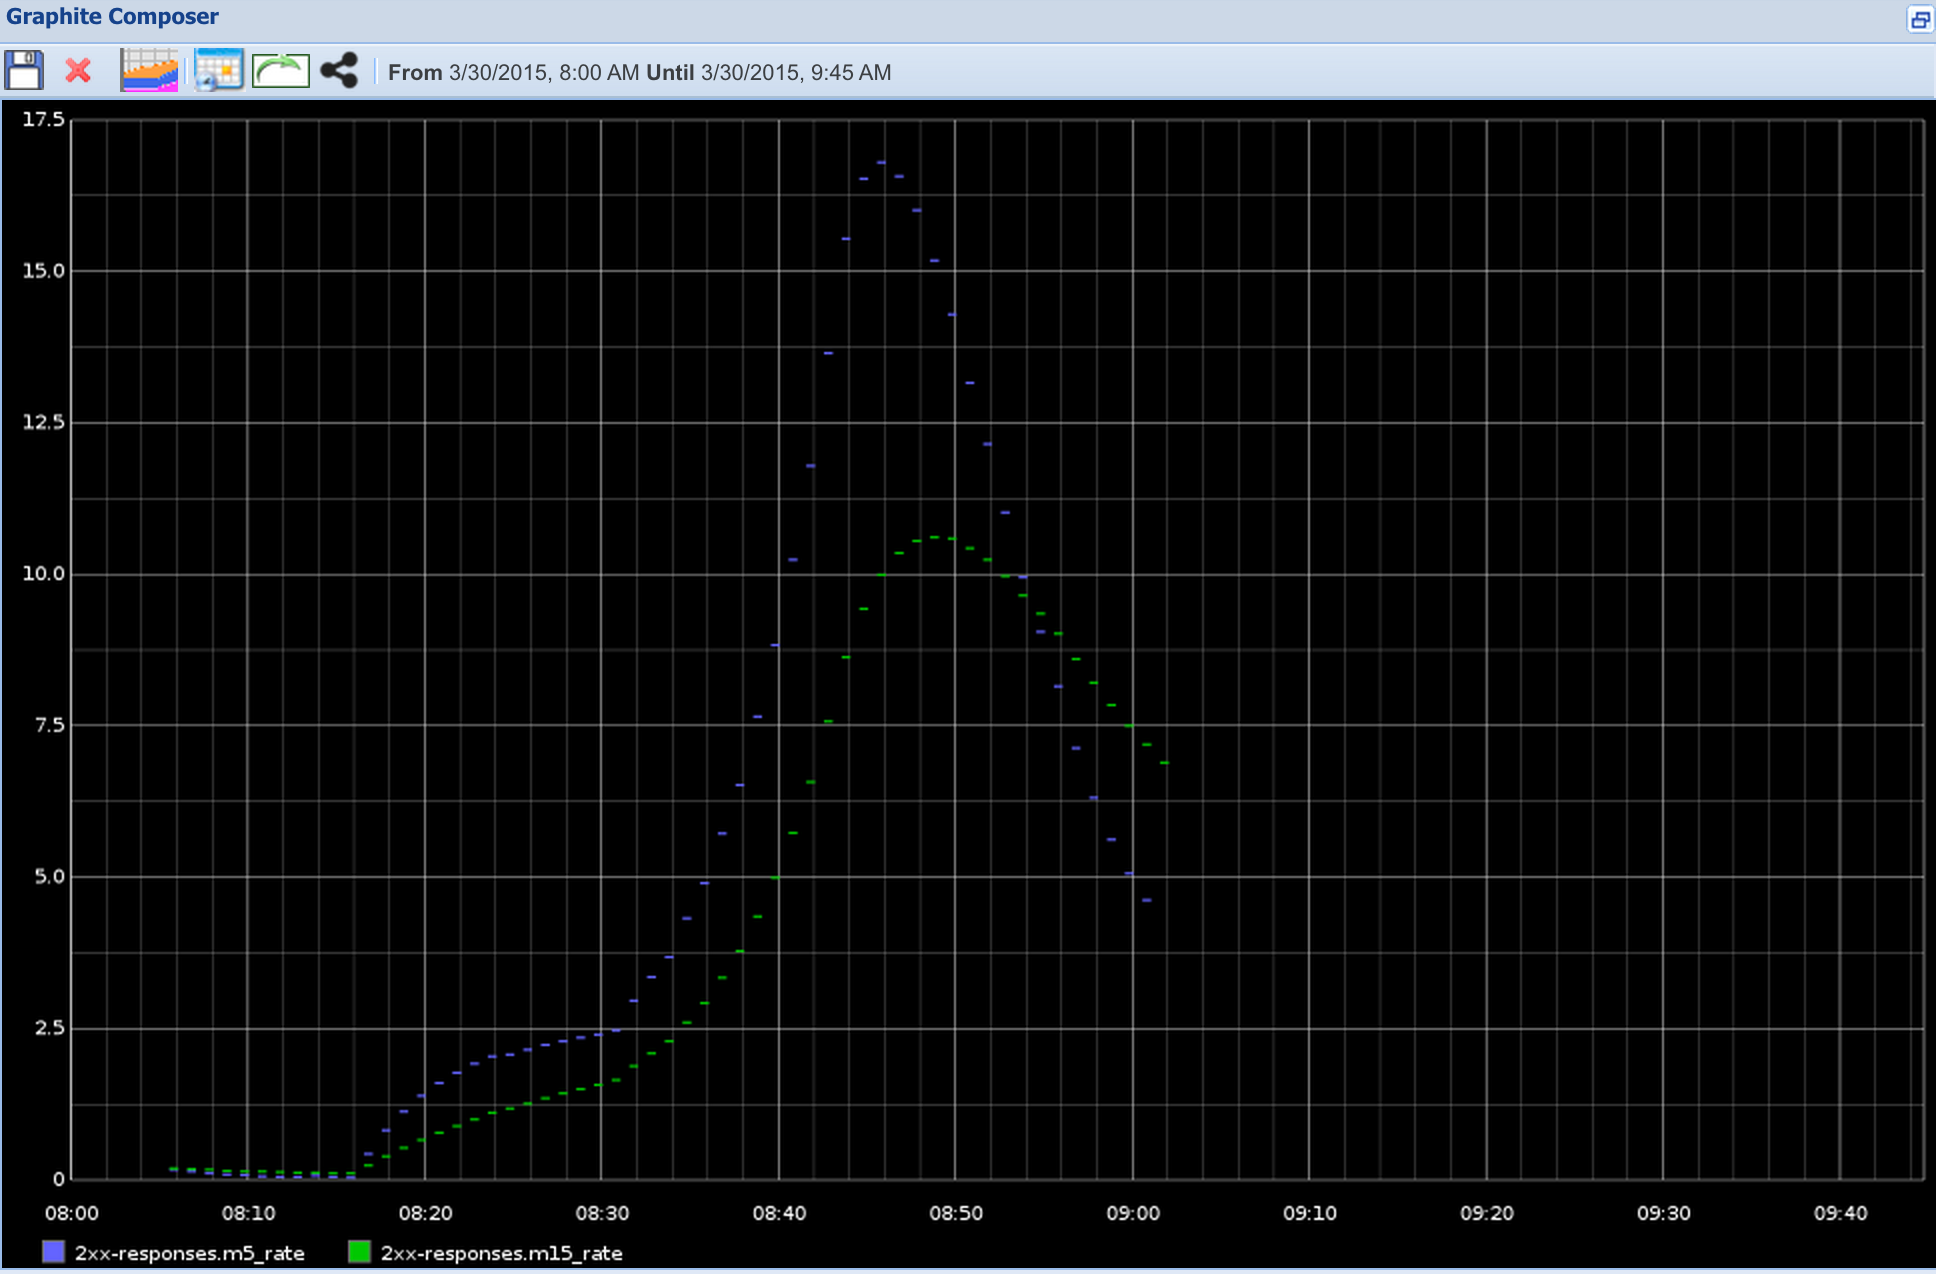
To test the reporting I ran some ApacheBench scripts with changing concurrent requests to represent increasing/decreasing load. Below shows a graph detailing 2xx response types:
Detail
See the source for full instructions on running and deploying the application to heroku.
I based the implementation from the metrics-play play plugin, which is written in Scala. I wanted a clear Java Play implementation which gave me control over the metrics names, but if you want to quickly add metrics into your Play application without fuss this is a good plugin.
This example creates metrics registries for JVM, Logback and request details by hooking into the Play application using theGlobal.java file, using the filters() and onStart methods.
public class Global extends GlobalSettings {
...
    @Override
    public <T extends EssentialFilter> Class<T>[] filters() {
        return new Class[]{MetricsFilter.class};
    }
...
    @Override
    public void onStart(Application application) {
        super.onStart(application);

        setupMetrics(application.configuration());

        setupGraphiteReporter(application.configuration());
    }
...
    private void setupMetrics(Configuration configuration) {
        ...
        if (metricsJvm) {
            metricRegistry.registerAll(new GarbageCollectorMetricSet());
            metricRegistry.registerAll(new MemoryUsageGaugeSet());
            metricRegistry.registerAll(new ThreadStatesGaugeSet());
        }

        if (metricsLogback) {
            InstrumentedAppender appender = new InstrumentedAppender(metricRegistry);

            ch.qos.logback.classic.Logger logger =
                (ch.qos.logback.classic.Logger)Logger.underlying();
            appender.setContext(logger.getLoggerContext());
            appender.start();
            logger.addAppender(appender);
        }

        if (metricsConsole) {
            ConsoleReporter consoleReporter = ConsoleReporter.forRegistry(metricRegistry)
                .convertRatesTo(TimeUnit.SECONDS)
                .convertDurationsTo(TimeUnit.MILLISECONDS)
                .build();
            consoleReporter.start(1, TimeUnit.SECONDS);
        }
    }
...
    private void setupGraphiteReporter(Configuration configuration) {
        boolean graphiteEnabled = configuration.getBoolean("graphite.enabled", false);

        if (graphiteEnabled) {
            ...
            final Graphite graphite = new Graphite(new InetSocketAddress(host, port));
            graphiteReporter = GraphiteReporter.forRegistry(metricRegistry)
                .prefixedWith(prefix)
                .convertRatesTo(TimeUnit.SECONDS)
                .convertDurationsTo(TimeUnit.MILLISECONDS)
                .filter(MetricFilter.ALL)
                .build(graphite);

            graphiteReporter.start(period, periodUnit);
        }
    }
}
Metrics about the requests are captured using a Filter MetricsFilter, which is applied to all requests hitting the application and can see both the request header and result data.
public class MetricsFilter implements EssentialFilter {

    private final MetricRegistry metricRegistry = SharedMetricRegistries.getOrCreate("play-metrics");

    private final Counter activeRequests = metricRegistry.counter(name("activeRequests"));
    private final Timer   requestTimer   = metricRegistry.timer(name("requestsTimer"));

    private final Map<String, Meter> statusMeters = new HashMap<String, Meter>() ;

    public EssentialAction apply(final EssentialAction next) {

        return new MetricsAction() {

            @Override
            public EssentialAction apply() {
                return next.apply();
            }

            @Override
            public Iteratee<byte[], Result> apply(final RequestHeader requestHeader) {
                activeRequests.inc();
                final Context requestTimerContext = requestTimer.time();

                return next.apply(requestHeader).map(new AbstractFunction1<Result, Result>() {

                    @Override
                    public Result apply(Result result) {
                        activeRequests.dec();
                        requestTimerContext.stop();
                        String statusFirstCharacter = String.valueOf(
                            result.header().status()).substring(0,1);
                        if (statusMeters.containsKey(statusFirstCharacter)) {
                            statusMeters.get(statusFirstCharacter).mark();
                        }
                        return result;
                    }

                    @Override
                    public <A> Function1<Result, A> andThen(Function1<Result, A> result) {
                        return result;
                    }

                    @Override
                    public <A> Function1<A, Result> compose(Function1<A, Result> result) {
                        return result;
                    }

                }, Execution.defaultExecutionContext());
            }


        };
    }

    public abstract class MetricsAction extends
        AbstractFunction1<RequestHeader, Iteratee<byte[], Result>>
        implements EssentialAction {}
}
Customisation and improvements
This example gives basic metrics on the Application, but for your own solution you would probably want to get specific metrics about controller actions. You can do this by either creating your own Play Filters and attaching them to the action methods or coding metrics directly into the actions. I used the Dropwizard Metrics own style for reporting on requests (2xx-responses) but you may be interested in specific results or requests and can use the Filter to intercept and report on these.

